
How do I read backtest returns, win rate and maximum drawdown?
Last updated ·
Interpret annualized return, profit factor and Sharpe ratio alongside costs, trade counts and test conditions.
Check test conditions first
Confirm the strategy revision, market, instrument, start and end dates, candle interval, initial capital, position sizing and cost assumptions. When comparing a publisher's benchmark with a local backtest, list differences in those conditions first.
Review the number of completed trades, any open positions and the equity curve. With zero trades, check data coverage and signals. With few trades, extend the period to inspect more observations.
Period return and annualized return
Period return measures the percentage return over the selected test window. Check the report's definition for its treatment of fees and unrealized P&L.
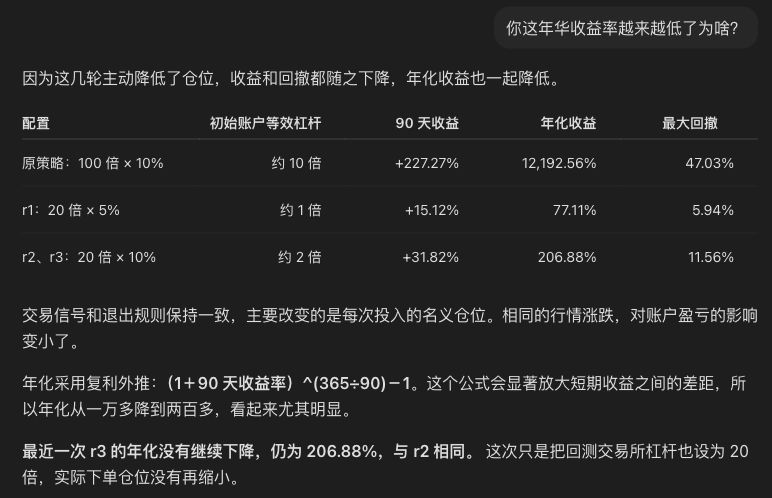
Annualized return expresses period performance as a yearly rate. A common compound formula is (1 + period return)^(365 / days tested) − 1, with return expressed as a decimal. A strong short period can produce a very large annualized number.
Win rate and profit factor
Win rate usually means profitable closed trades divided by all closed trades. Profit factor usually means total gross profit divided by the absolute value of total gross loss.
Many small wins followed by one large loss can produce a high win rate and a negative return. Also inspect average win, average loss, total costs and trade count.
Maximum drawdown and Sharpe ratio
Maximum drawdown is the largest percentage decline from an earlier equity peak to a later trough in the selected curve. Check whether the curve includes unrealized losses and fees, and how often it is sampled.
Sharpe ratio relates return to volatility. Compare reports using consistent return sampling, annualization and risk-free-rate assumptions.
Compare different backtest windows
Separate 30-, 90- and 365-day tests may each start flat with the full initial balance. At the same calendar date, their positions, equity and sizing paths can differ.
Record period return, maximum drawdown, completed trade count, costs and the longest flat period. To break down a full year's performance, use fills and the equity curve from that same run.
Review the backtest checklist